
SonicOS 8 SD-WAN
Table of Contents
About SLA Probes
Network path performance metrics are determined using SD-WAN SLA probes, which are similar to Network Monitor Probes. SonicOS supports Ping, TCP, HTTP, and HTTPS probe types. An SD-WAN SLA probe can be used by multiple Path Selection Profiles, for further information, see About Path Selection Profiles.
The NETWORK | SD-WAN > SLA Probes page shows the dynamic performance data (latency/jitter/packet loss) and probe status for each path (interface) in the SD-WAN group, in both tabular and graphic displays. The display can show data for the last minute (default), last day, last week, or last month.
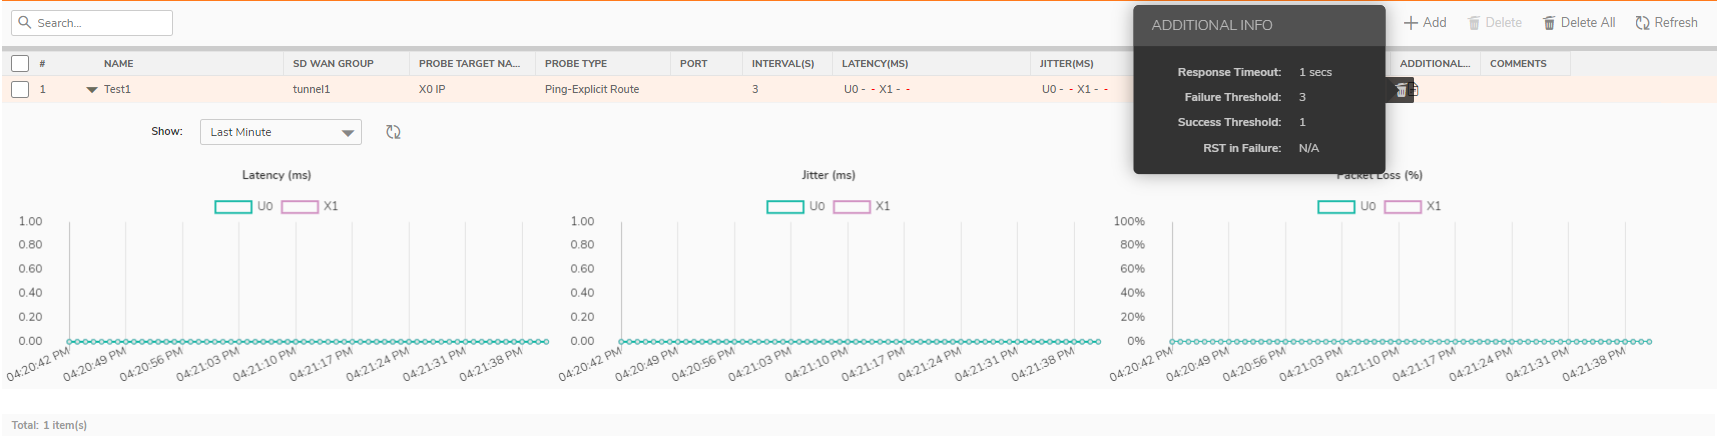
| # | Number of the probe. The Collapse/Expand icon toggles the display of the graphs. |
| NAME | Name of the SD-WAN SLA probe. |
| SD-WAN GROUP | Name of the SD-WAN group associated with the SD-WAN SLA probe. |
| PROBE TARGET NAME |
Target address object of the SD-WAN SLA probe. This field is empty for VPN-based interfaces. For a Hybrid group, the field is empty for VPN tunnel members and shows the probe target for non‑VPN members. |
| PROBE TYPE |
Type of SLA probe:
When Ping‑Explicit Route is selected, the Port and RST Response Counts As Miss options are disabled. The HTTP‑Explicit Route and HTTPS‑Explicit Route options are supported in SonicOS 8.2.1 and later versions. |
| PORT |
Port for the SD-WAN SLA probe. The minimum/maximum values are 1 to 65535. HTTP and HTTPS probes also use a port. A hyphen (–) displays for Ping‑Explicit Route probe types. |
| INTERVAL (S) | Time between SD-WAN SLA probes, in seconds. |
| LATENCY (MS) | Round trip delay for the probes sent through a particular path/interface to reach the probe target and acknowledge back, in milliseconds. This is also displayed as a graph below the probe’s entry in the SLA Probe table. |
| JITTER (MS) | Variation in the latency measurements for the probes through a particular path/interface, in milliseconds. This is also displayed as a graph below the probe’s entry in the SLA Probe table. |
| PACKET LOSS (%) | Percentage of probes that are missed of the probes sent through a particular path/interface. This is also displayed as a graph below the probe’s entry in the SLA Probe table. |
| ADDITIONAL INFO | When you hover over the icon, you can view the data for the following: Response timeout, Success Threshold, Failure Threshold, & RST in Failure. |
| COMMENTS |
Displays the comment entered when the SLA probe was configured. |