-
Products
-
SonicPlatform
SonicPlatform is the cybersecurity platform purpose-built for MSPs, making managing complex security environments among multiple tenants easy and streamlined.
Discover More
-
-
Solutions
-
Federal
Protect Federal Agencies and Networks with scalable, purpose-built cybersecurity solutions
Learn MoreFederalProtect Federal Agencies and Networks with scalable, purpose-built cybersecurity solutions
Learn More - Industries
- Use Cases
-
-
Partners
-
Partner Portal
Access to deal registration, MDF, sales and marketing tools, training and more
Learn MorePartner PortalAccess to deal registration, MDF, sales and marketing tools, training and more
Learn More - SonicWall Partners
- Partner Resources
-
-
Support
-
Support Portal
Find answers to your questions by searching across our knowledge base, community, technical documentation and video tutorials
Learn MoreSupport PortalFind answers to your questions by searching across our knowledge base, community, technical documentation and video tutorials
Learn More - Support
- Resources
- Capture Labs
-
- Company
- Contact Us
Useful troubleshooting tools and Diagnostic files on NSSP 13700


Description
This KB explains about useful troubleshooting tools available on NSSP 13700. It also explains the diagnostics files that can be collected from NSSP 13700 to be provided to SonicWall support.
Resolution
Troubleshooting Tools:
- Packet Monitor:
The Packet Monitor Feature on the SonicWall is one of the most powerful and useful tool for troubleshooting a wide variety of issues. Any packets which pass through the SonicWall can be viewed, examined, and even exported to tools like Wireshark.
You can configure packet monitor under Monitor | Tools & Monitors | Packet Monitor.
 NOTE: To understand how to set up a Packet Monitor, the various common use options, and how to read the output from a successful Packet Monitor, please refer to the link below.
How Can I Setup And Utilize The Packet Monitor Feature For Troubleshooting? - Connections monitor:
The Connections Monitor displays real-time, exportable (plain text or CSV), filterable views of all connections to and through the firewall.
To use Connections Monitor, navigate to Monitor | Tools & Monitors | Connections.
- System Monitor:
The system monitor shows the multicore view that displays dynamically updated statistics on the utilization of the individual cores of the firewall.
It also shows the top applications utilizing the bandwidth in real-time.
To use System monitor, navigate to Monitor | Real-Time Charts | System Monitor.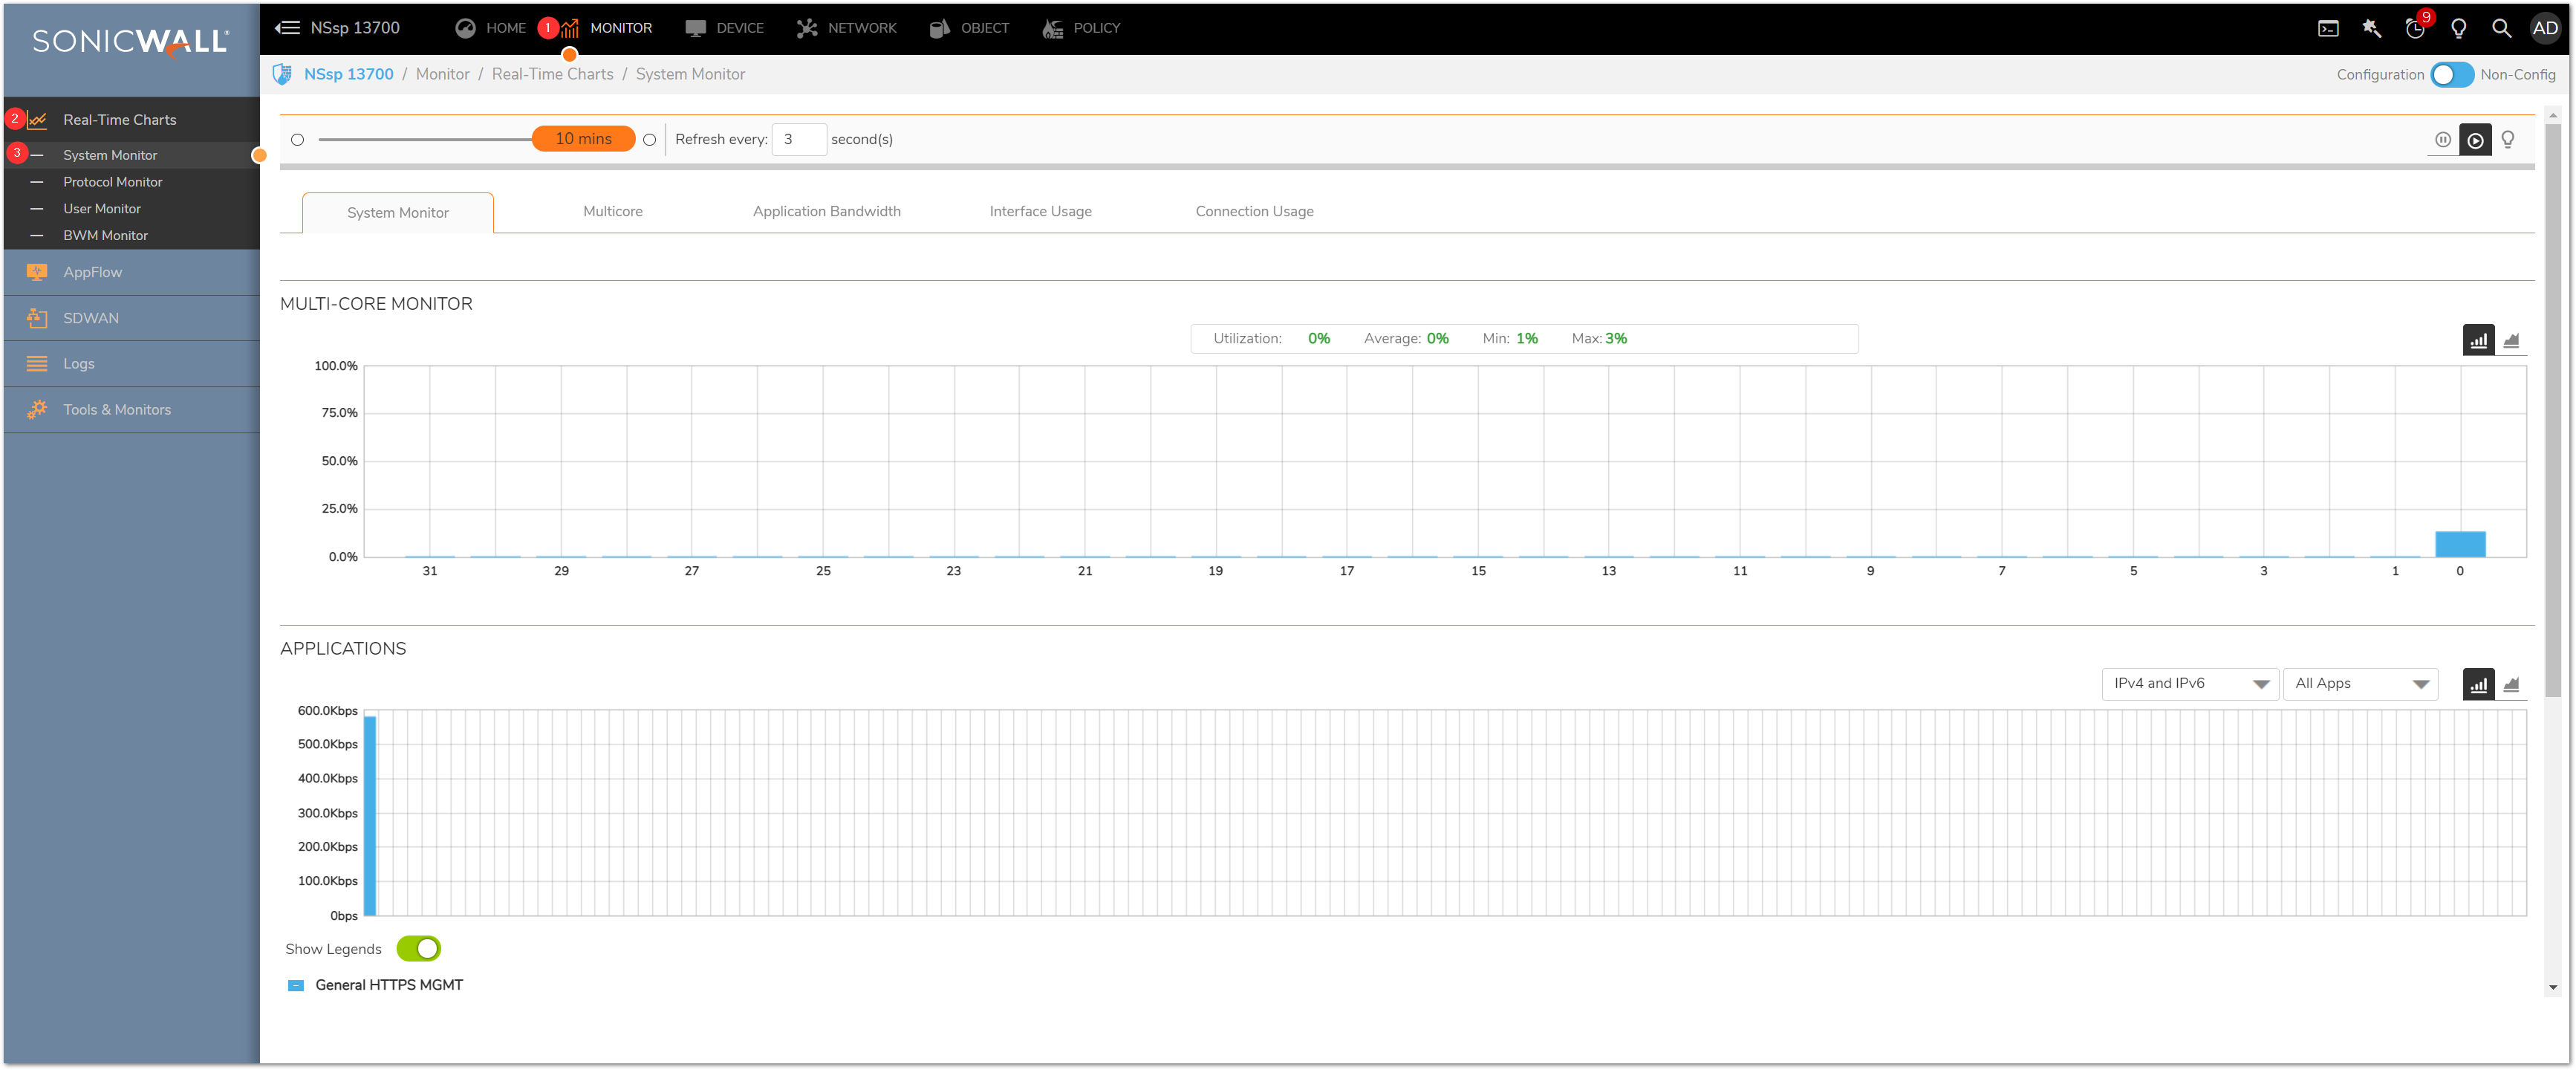
- Core 0 Processes:
The Core 0 Process Monitor shows the individual system processes on core 0, their CPU utilization, and their system time.
To check the Core 0 processes, navigate to Monitor | Tools & Monitors | Core 0 Processes.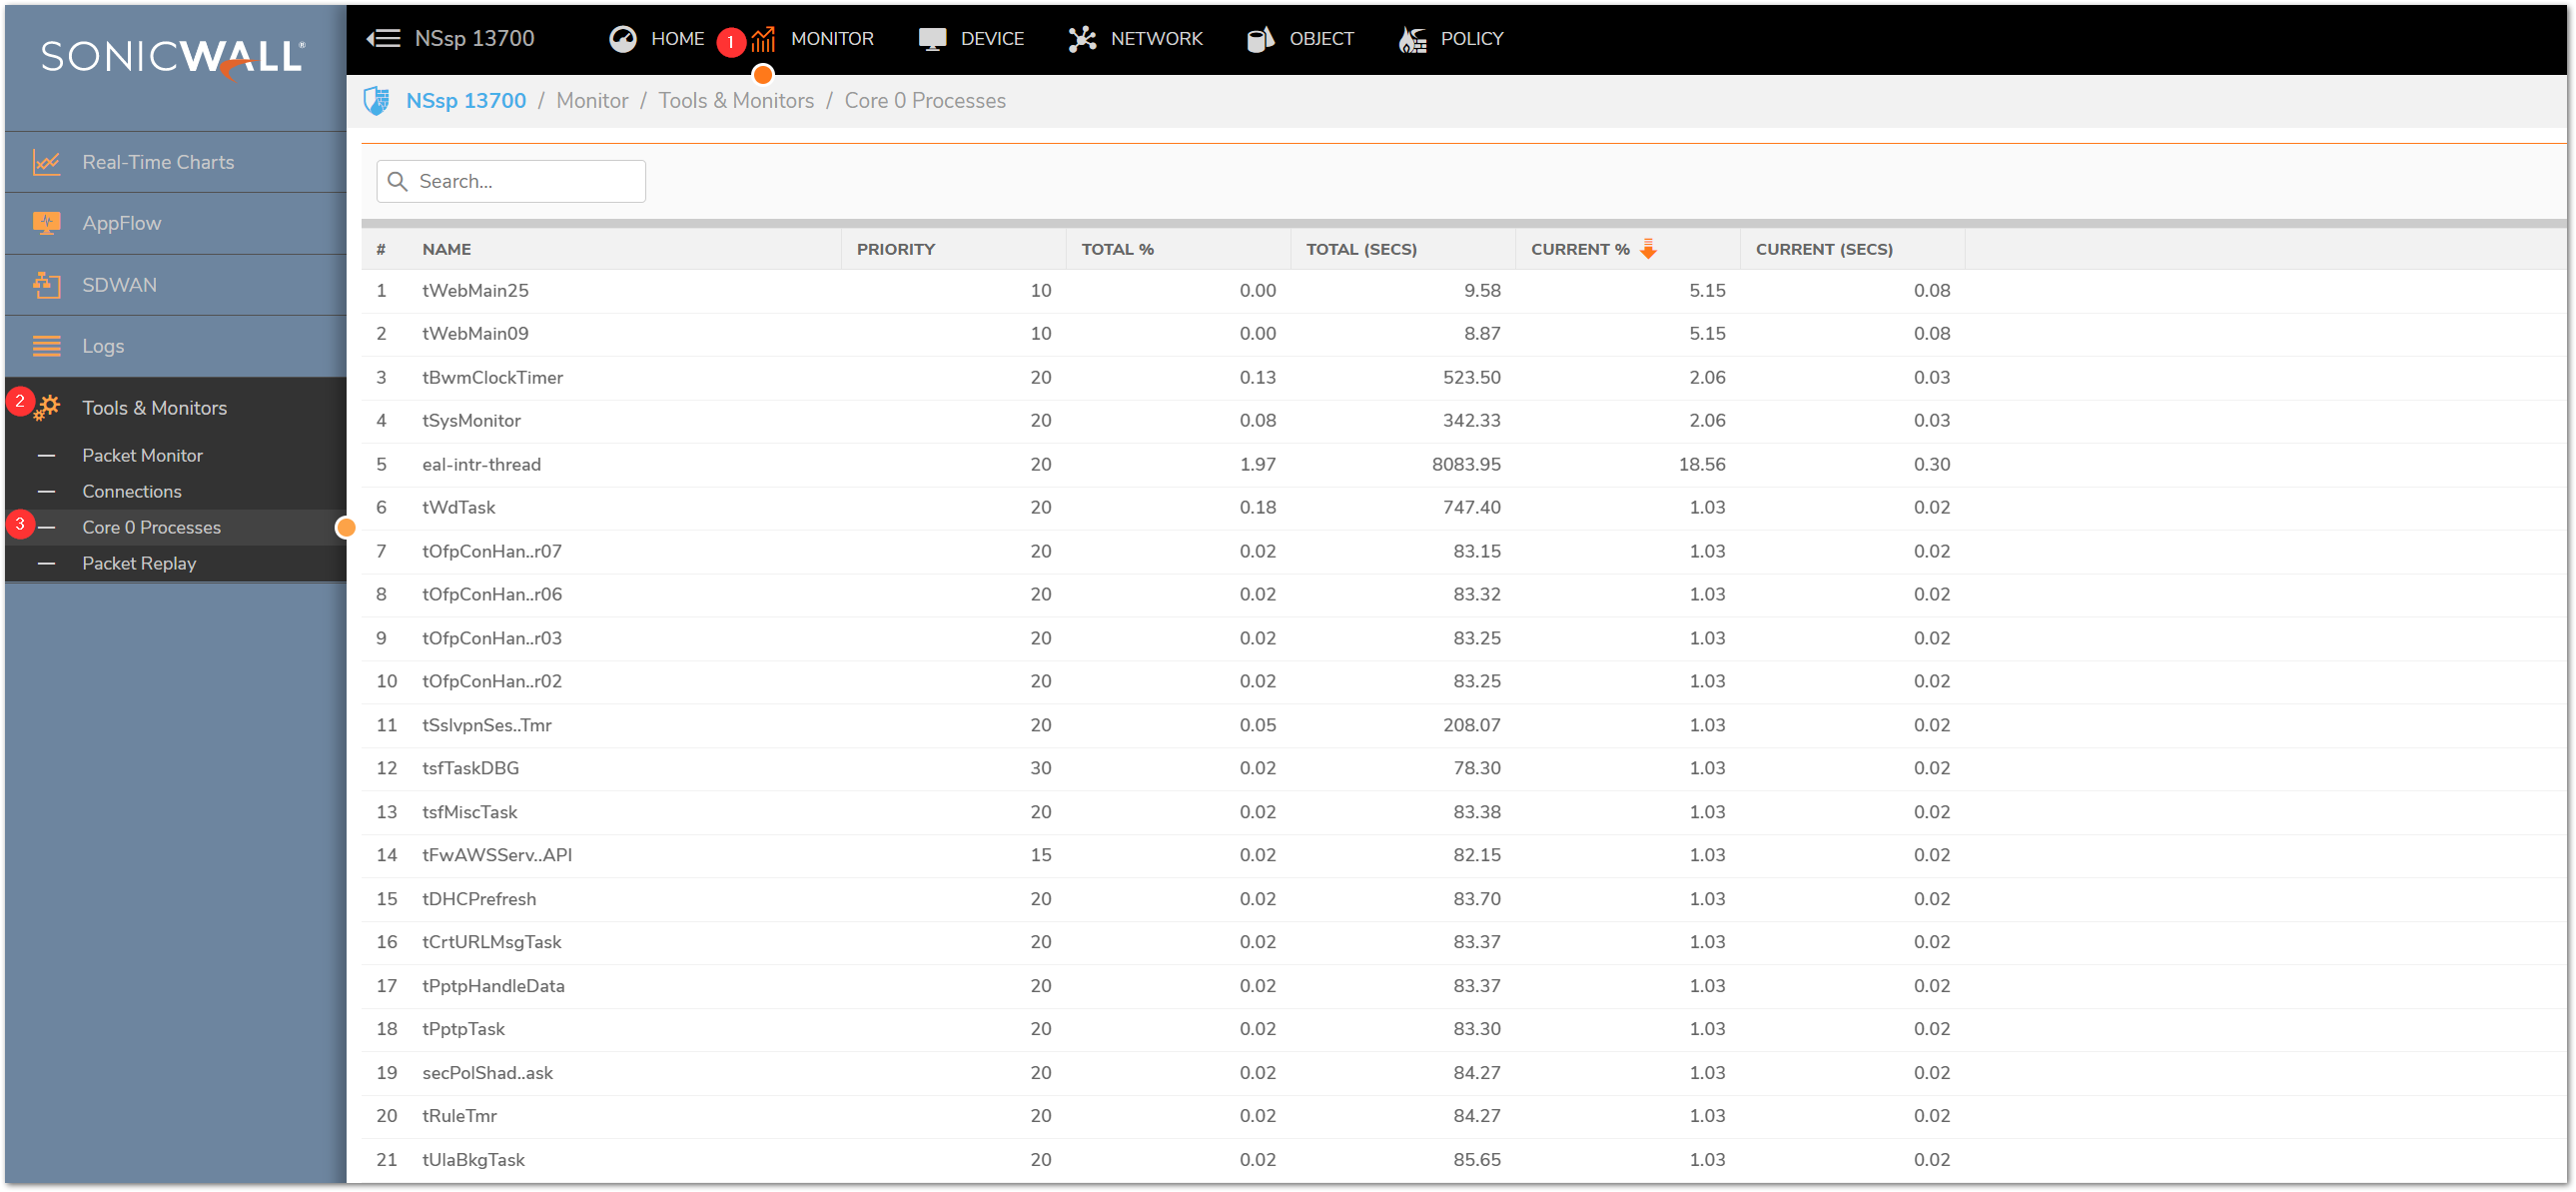
- SSH terminal:
The terminal feature allows the user to perform terminal functions such as running debug commands without launching the terminal application separately (as with SSH through putty/Tera Term) or logging in to the console port. Users can easily view the result from the web browser and copy the result.
You can click on the cli icon on the top right hand side of the UI, to launch the terminal.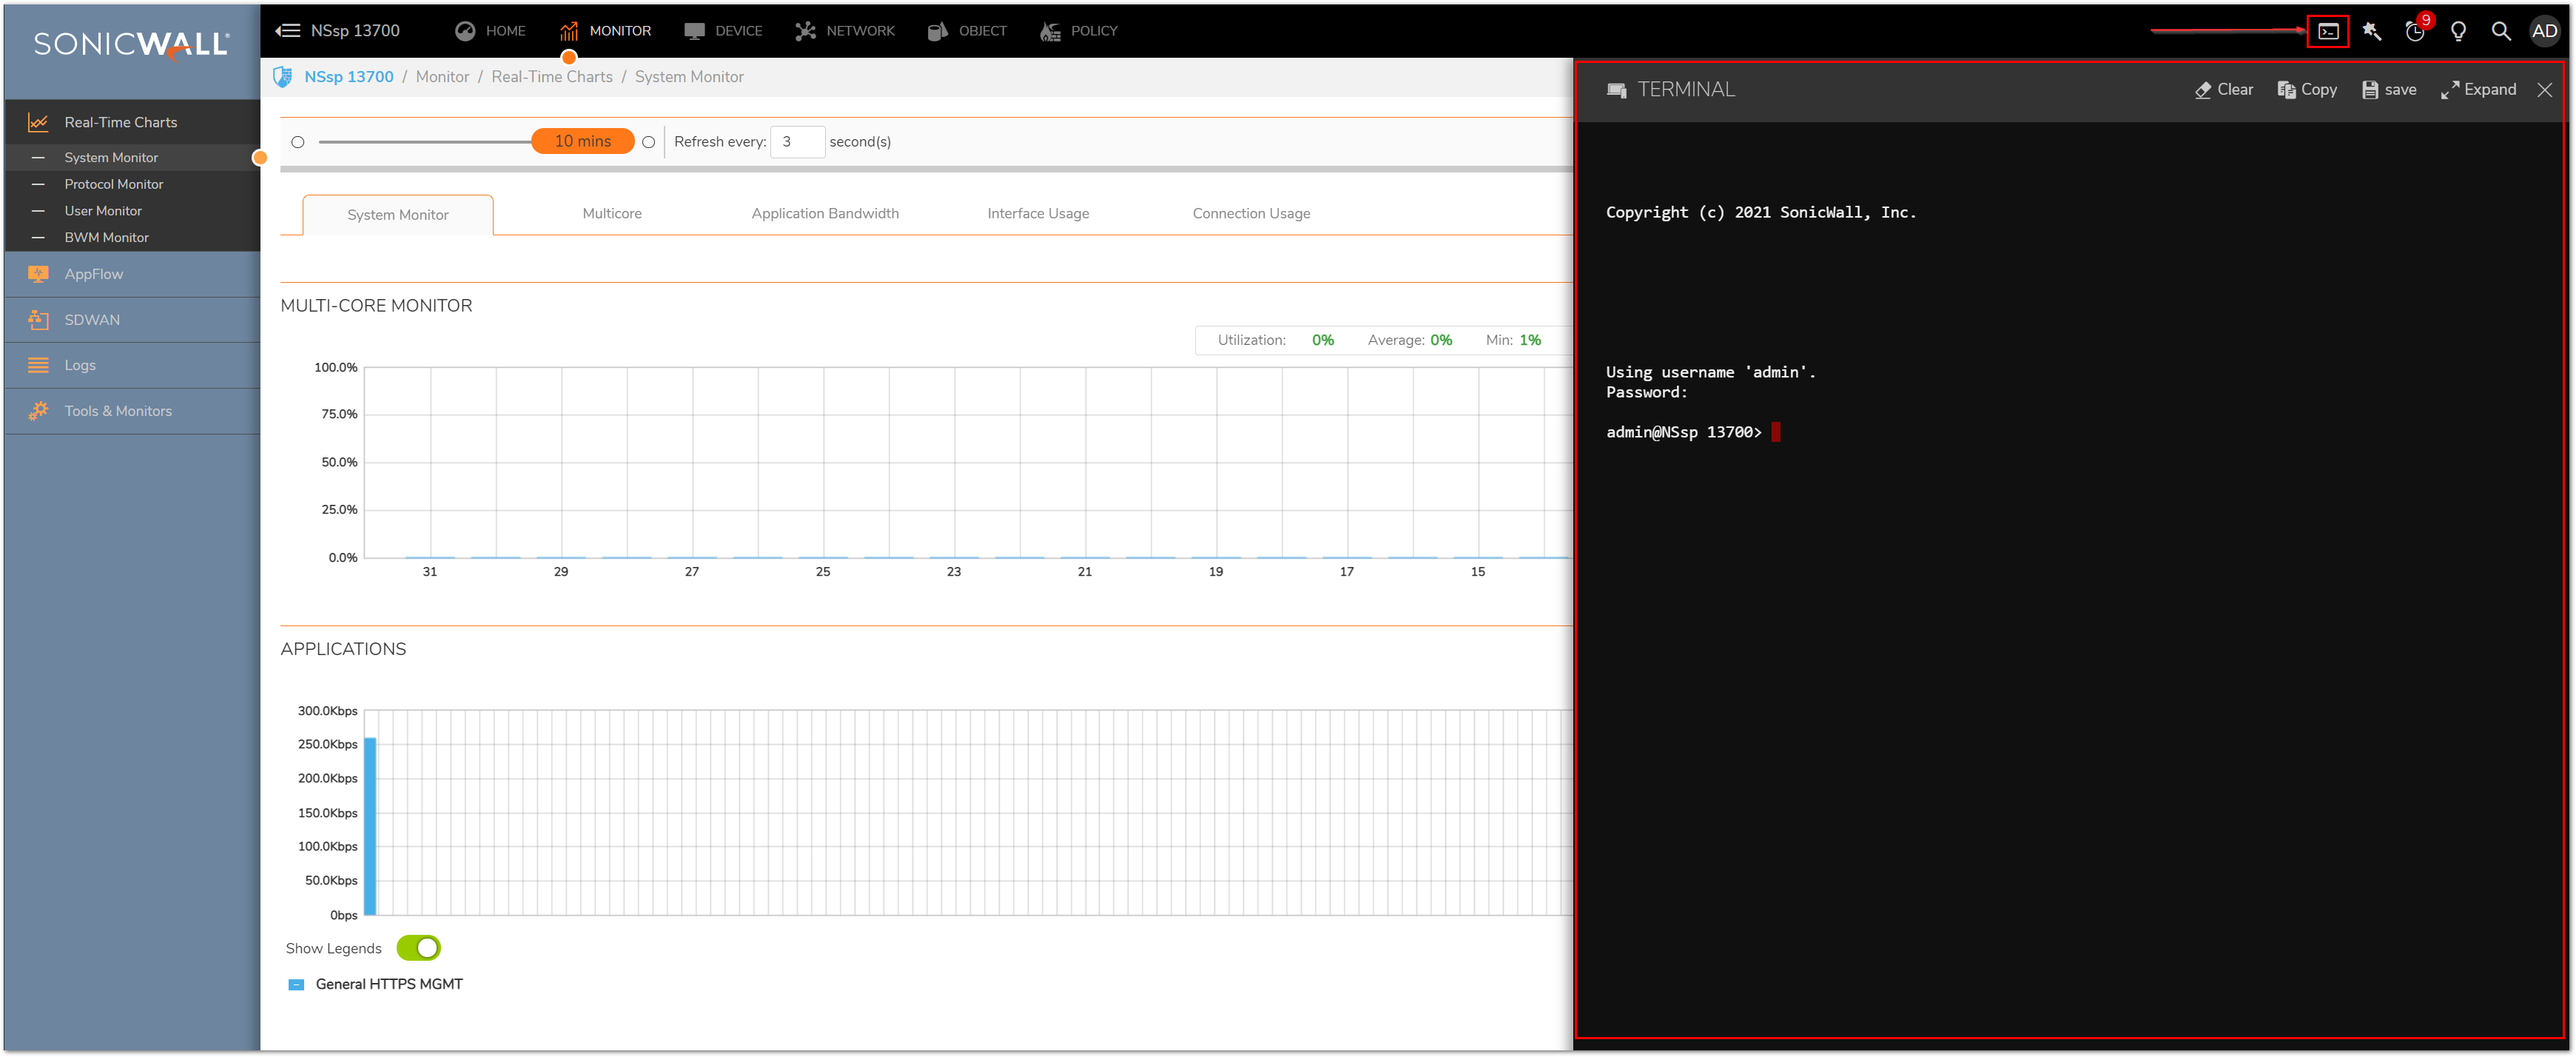
 NOTE: For more details on the SSH terminal, please refer to the link below.
How To Launch SSH Terminal Application From UI On SonicOS 7.0/SonicOSX 7.0 TIP: There are many other useful troubleshooting tools like Check Network Settings, DNS Name Lookup, Network Path, Ping, Trace Route, Real-Time Blacklist, Reverse Name Lookup, Connection TopX, Geo and Botnet, MX and Banner, URL Rating Request, PMTU Discovery, Switch Diagnostics etc. You can navigate to Device | Diagnostics to use them. For more details, please refer to SonicOS7 Diagnostics
After taking help from the above troubleshooting tools, if the issue is still not resolved, you can reach out to SonicWall Support using the following link.
There are two ways to contact technical support:1. Online: Visit mysonicwall.com. Once logged in select Resources & Support | Support | Create Case.
2. By phone: please use our toll-free number at 1-888-793-2830. Please have your SonicWall serial number available to create a new support case.
If you do not have a mysonicwall.com account create one for free!
If for any reason the firewall is not working as expected the following files should be sent to support to diagnose and resolve your request more efficiently. Providing all logs can provide a big picture for support to identify any previously unknown or ongoing issue. Streamline your experience with support, upload complete logs upon case creation to save your time spent on the phone or back and forth with support.
Diagnostic Files:
- TSR, Settings (EXP), GUI Logs, Trace Logs, and Console Logs:
a) TSR: The Tech Support Report generates a detailed report of the SonicWall security appliance configuration and status and saves it to the local hard disk using the DOWNLOAD REPORT button.
b) Settings (EXP): The current configuration of your SonicWall appliance is exported to a .exp file and is available in your local system. The file can be imported by the same SonicWall or used to clone a configuration across multiple SonicWall systems.
c) GUI Logs (Event logs): These are system events, and are captured and are very helpful for troubleshooting as well as logging.
d) Tracelogs: The trace log is a log of diagnostic events that SonicWall records into an area of its memory that is persistent through a reboot. After a reboot that recorded during the previous session is saved to non-volatile flash during startup, where the last 8 trace logs are saved.
e) Console Logs: Console logs should be provided for analysis when the device isn't responding via GUI or through any LAN/WAN interfaces. When the firewall locks up or becomes unresponsive there are some files, if gathered from firewall console at the time it locks up, that can help a support engineer find the probable root cause of the reported issue.
You can refer to the link below to understand the procedure used to collect these files.
How Can I Download Required Tech Support Files (TSR, Settings, GUI Logs, Trace Logs)? - System Logs and Core dump:
The system logs can be downloaded by navigating to Device | Diagnostics | Tech Support Report.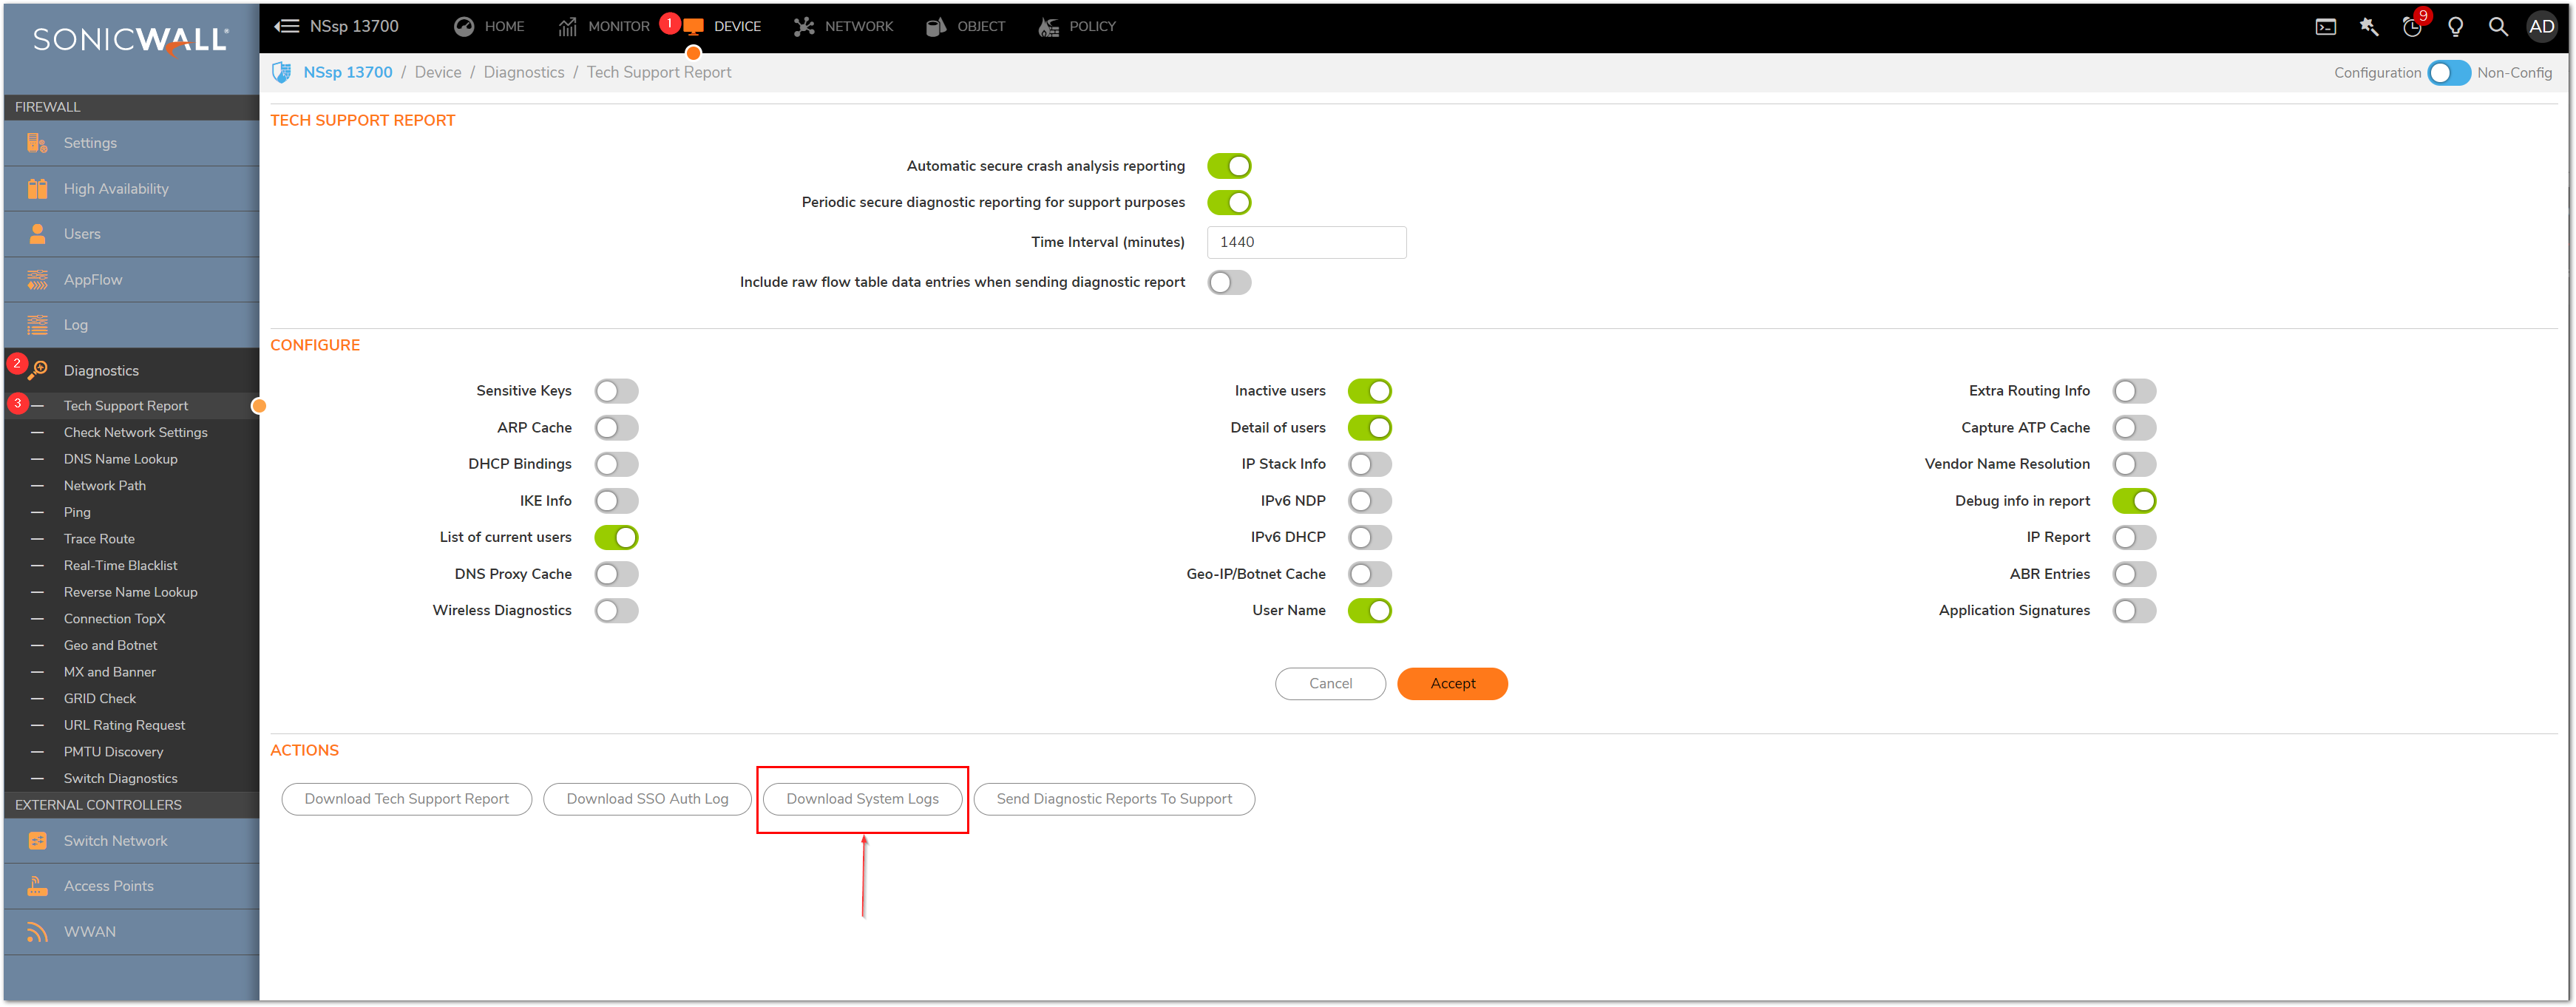
The core dump is available on the diag page of the firewall. To access the diag page, on the address bar, add /settings/diag after the Mgmt as https://<management_ip>/sonicui/7/m/Mgmt/settings/diag
Click on Internal Settings. Click on Download Core Dump.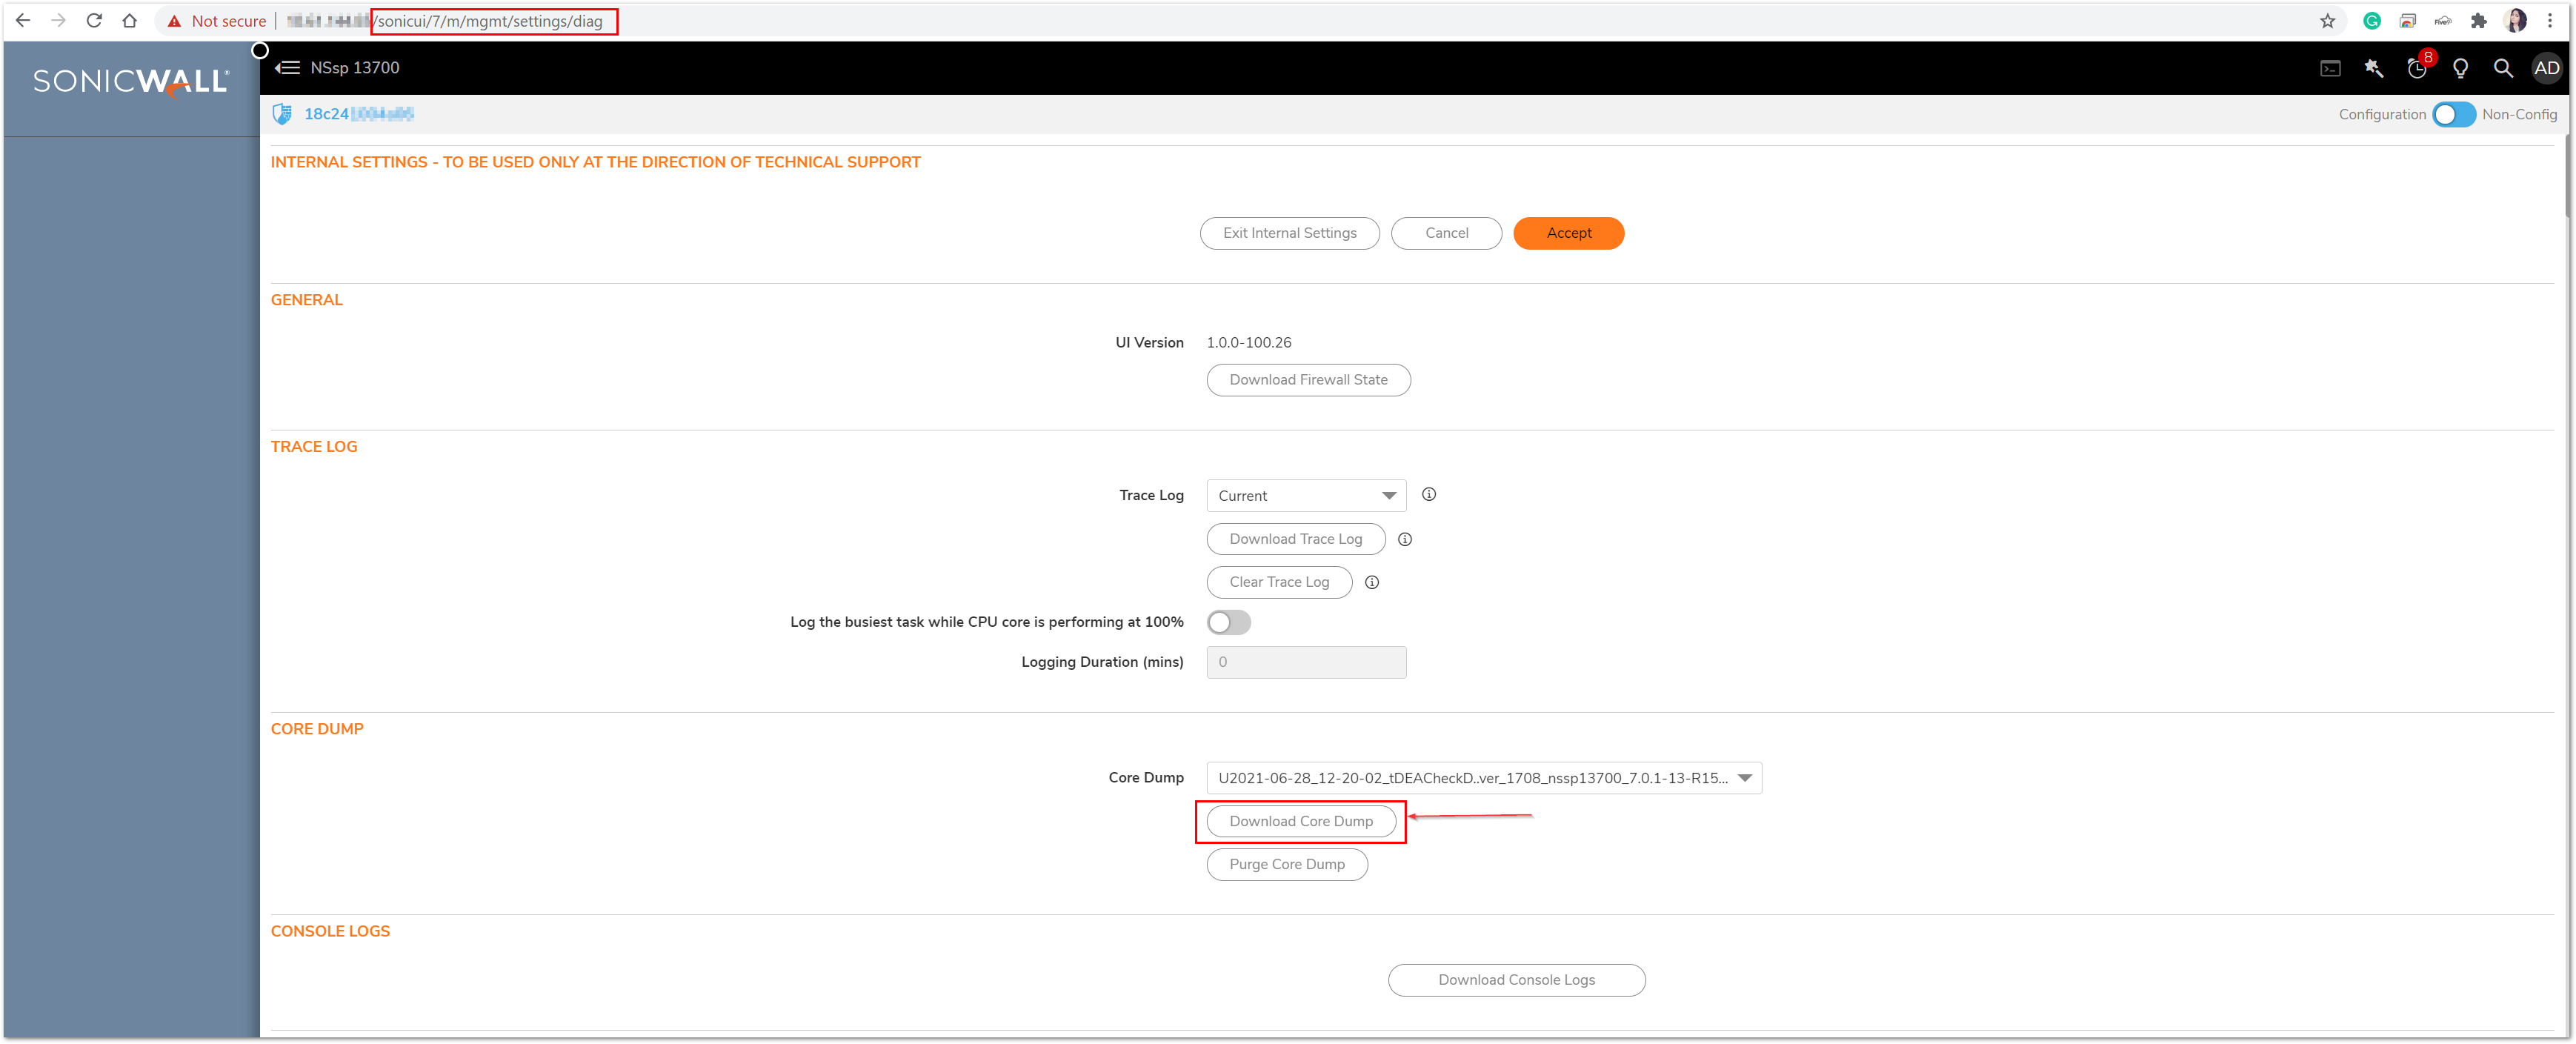
Related Articles
- Error:"Invalid API Argument" when modifying the access rules
- Cysurance Partner FAQ
- Configure probe monitoring for WAN Failover and Loadbalancing - SonicWall UTM


 YES
YES NO
NO