-
Products
-
SonicPlatform
SonicPlatform is the cybersecurity platform purpose-built for MSPs, making managing complex security environments among multiple tenants easy and streamlined.
Discover More
-
-
Solutions
-
Federal
Protect Federal Agencies and Networks with scalable, purpose-built cybersecurity solutions
Learn MoreFederalProtect Federal Agencies and Networks with scalable, purpose-built cybersecurity solutions
Learn More - Industries
- Use Cases
-
-
Partners
-
Partner Portal
Access to deal registration, MDF, sales and marketing tools, training and more
Learn MorePartner PortalAccess to deal registration, MDF, sales and marketing tools, training and more
Learn More - SonicWall Partners
- Partner Resources
-
-
Support
-
Support Portal
Find answers to your questions by searching across our knowledge base, community, technical documentation and video tutorials
Learn MoreSupport PortalFind answers to your questions by searching across our knowledge base, community, technical documentation and video tutorials
Learn More - Support
- Resources
- Capture Labs
-
- Company
- Contact Us
Overview of the Connections Monitor


Description
The Connections Monitor displays real-time, exportable (plain text or CSV), filterable views of all connections to and through the firewall.
To use Connections Monitor, navigate to System | Diagnostics page, select the option Connections Monitor from the dropdown list.

Resolution
Connections Monitor Settings
You can filter the results to display only connections matching certain criteria. You can filter by Source Address, Destination Address, Destination Port, Protocol, Flow Type, Src Interface, and Dst Interface. Enter your filter criteria in the Connections Monitor Settings table.
The fields you enter values into are combined into a search string with a logical AND. For example, if you enter values for Source IP and Destination IP, the search string will look for connections matching:
Source IP AND Destination IP
Check the Group Filters box next to any two or more criteria to combine them with a logical OR. For example, if you enter values for Source Address, Destination Address, and Protocol, and check Group Filters next to Source Address and Destination Address, the search string will look for connections matching:
(Source IP OR Destination IP) AND Protocol
Click Apply Filter to apply the filter immediately to the Active Connections Monitor table. Click Reset Filters to clear the filter and display the unfiltered results again.
You can export the list of active connections to a file. Click Export Results, and select if you want the results exported to a plain text file, or a Comma Separated Value (CSV) file for importing to a spreadsheet, reporting tool, or database. If you are prompted to Open or Save the file, select Save. Then enter a filename and path and click OK.
Active Connections Monitor

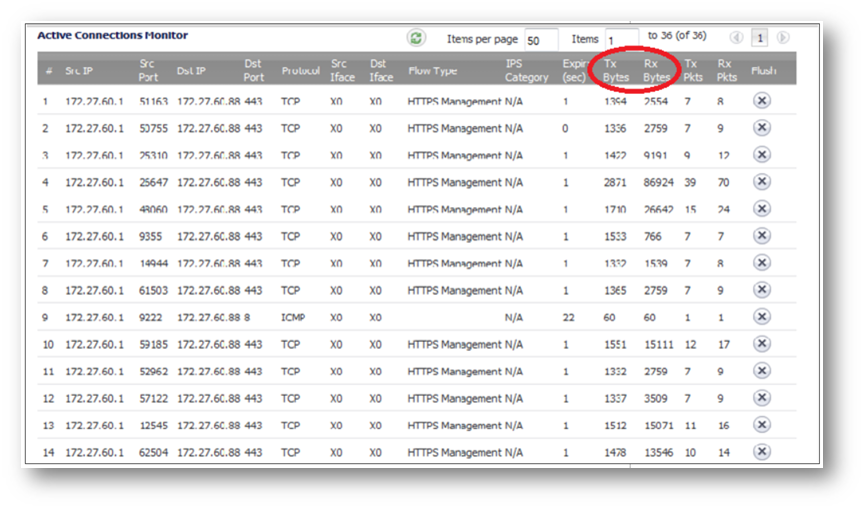
The Active Connection Monitor table shows information about all the active connections: Src IP, Src Port, Dst IP, Dst Port, Protocol, Src Iface, Dst Iface, Flow Type, IPS Category, Expiry (sec), TX Bytes, Rx Bytes, Tx Pkts, Rx Pkts. Click on a column heading to sort by that column. You can filter the results to display only connections matching certain criteria, as described in Connections Monitor Settings.
To refresh the data, click the Refresh icon above the table.
You can flush an individual connection by clicking its Delete icon in the Flush column. To flush all the connections, click the Flush All button at the bottom of the table.
Related Articles
- Error:"Invalid API Argument" when modifying the access rules
- Cysurance Partner FAQ
- Configure probe monitoring for WAN Failover and Loadbalancing - SonicWall UTM
Categories
- Firewalls > TZ Series
- Firewalls > SonicWall SuperMassive E10000 Series
- Firewalls > SonicWall SuperMassive 9000 Series
- Firewalls > SonicWall NSA Series


 YES
YES NO
NO