


-
Products
-
SonicPlatform
SonicPlatform is the cybersecurity platform purpose-built for MSPs, making managing complex security environments among multiple tenants easy and streamlined.
Discover More
-
-
Solutions
-
Federal
Protect Federal Agencies and Networks with scalable, purpose-built cybersecurity solutions
Learn MoreFederalProtect Federal Agencies and Networks with scalable, purpose-built cybersecurity solutions
Learn More - Industries
- Use Cases
-
-
Partners
-
Partner Portal
Access to deal registration, MDF, sales and marketing tools, training and more
Learn MorePartner PortalAccess to deal registration, MDF, sales and marketing tools, training and more
Learn More - SonicWall Partners
- Partner Resources
-
-
Support
-
Support Portal
Find answers to your questions by searching across our knowledge base, community, technical documentation and video tutorials
Learn MoreSupport PortalFind answers to your questions by searching across our knowledge base, community, technical documentation and video tutorials
Learn More - Support
- Resources
- Capture Labs
-
- Company
- Contact Us
Integrate On-Prem Analytics with NSM (On-Prem)
 11/10/2023
  15 People found this article helpful
 190,738 Views

Description
On-prem NSM integrates with SonicWall On-prem Analytics to provide integrated user interface to manage firewall policy and monitor network traffic. On-prem NSM can be integrated with SonicWall IPFIX or Syslog based analytics. After integration of on-prem NSM and on-prem analytics, data collected by the SonicWall analytics is available within NSM user interface. To integrate on-prem NSM and analytics requires specifying detail of analytics system in NSM, then enabling firewall to view analytic data and accessing firewall analytic data.
Note: Before proceeding with NSM integration please ensure desired SonicWall Analytics is working fine and firewall is configured to send data to analytics.
Resolution
Step1: Integrate SonicWall Analytics in NSM
To add On-Prem Analytics details in NSM:
Access NSM using IP address. Login with username and password.
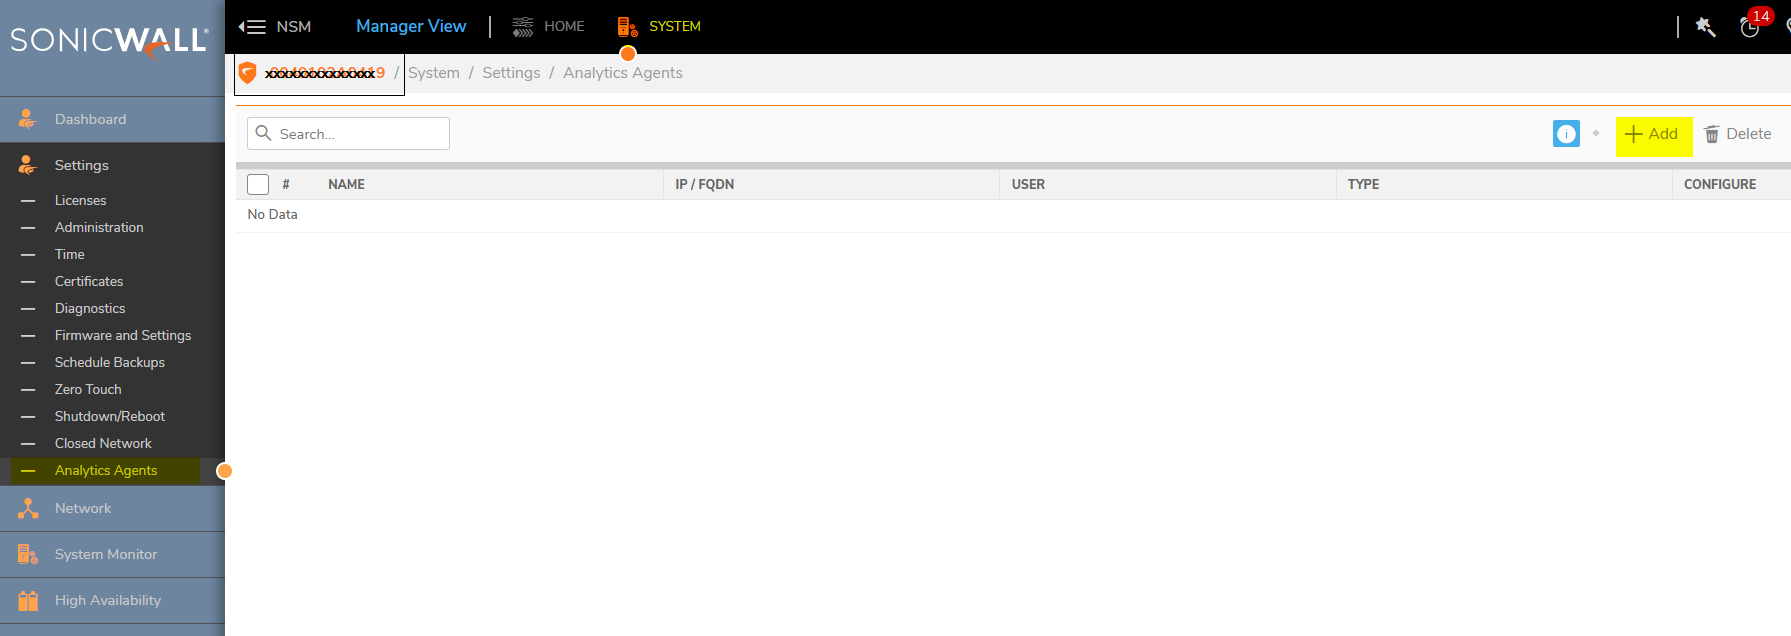
Under System, navigate to Settings > Analytics Agent.
Click on Add.
Enter the Name of the analytics agent and select Type of Analytics Install from the drop down. You can select Flow Analytics for Analytics On-Prem IPFIX and Syslog Analytics for Analytics On-Prem Syslog.
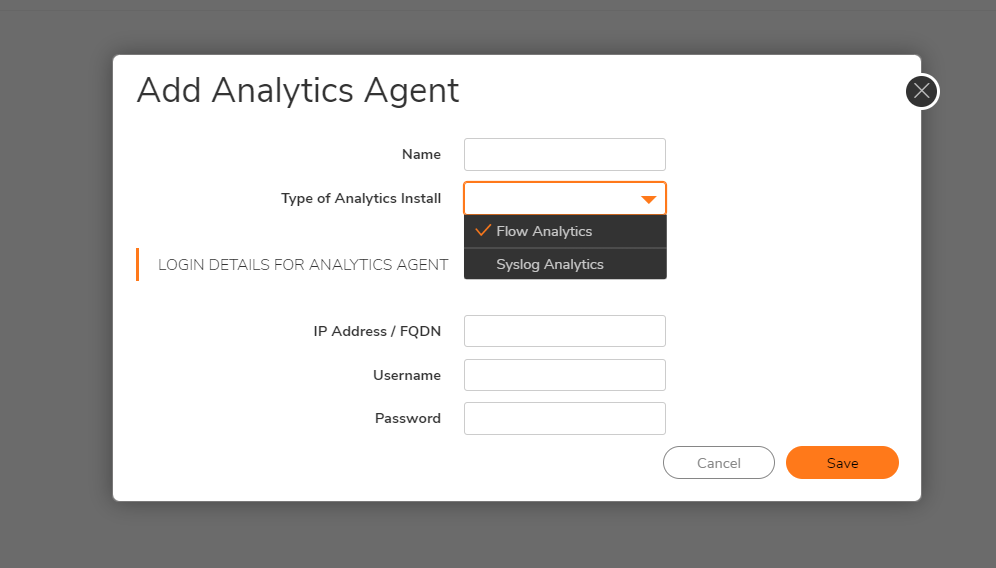
Click on Save.
Step2: Enable Analytics while adding new device.
To add an analytics agent while adding a new device:
- Under Home, navigate to Firewalls |Inventory.
- Click on Add.
- Add the new device information.
- Under Reporting and Analytics, enable the Integrate External Analytics Agent for this device button.
- Select the added analytics agent from the dropdown of Analytics Agent field. You can also add a new agent here by clicking on
 icon and selecting Add Analytics Agent in Analytics Agent.
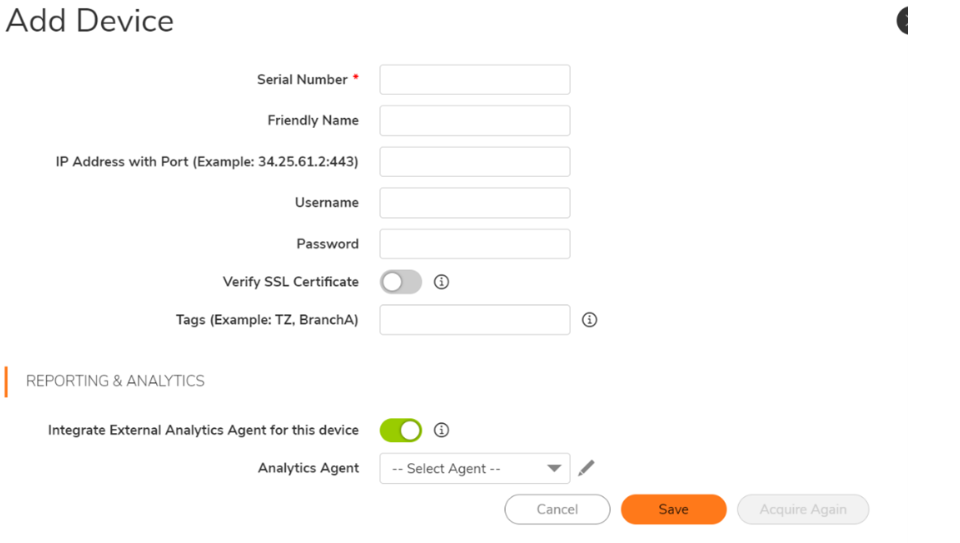
- Click Save.
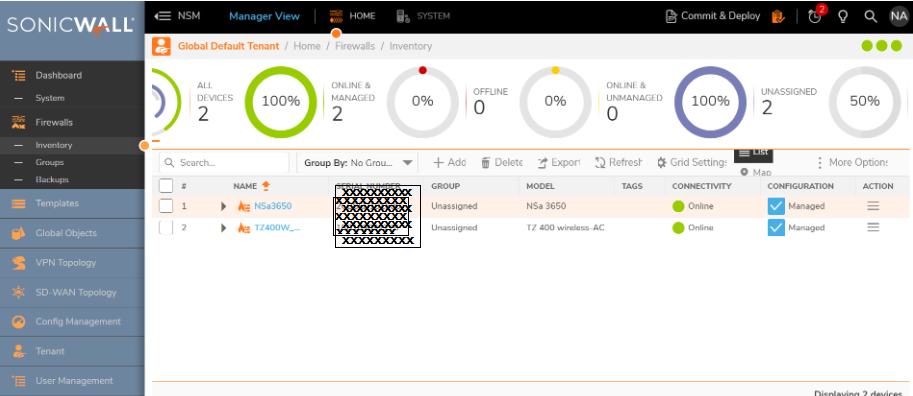
Step3: Enable firewall to view Analytics data
To add an analytics agent for zero-touch enabled or already added device in NSM:
- Under Home, navigate to Firewalls| Inventory.
- Select the firewall on which Analytics is running and click on
 icon below Action column and click on Edit Settings.
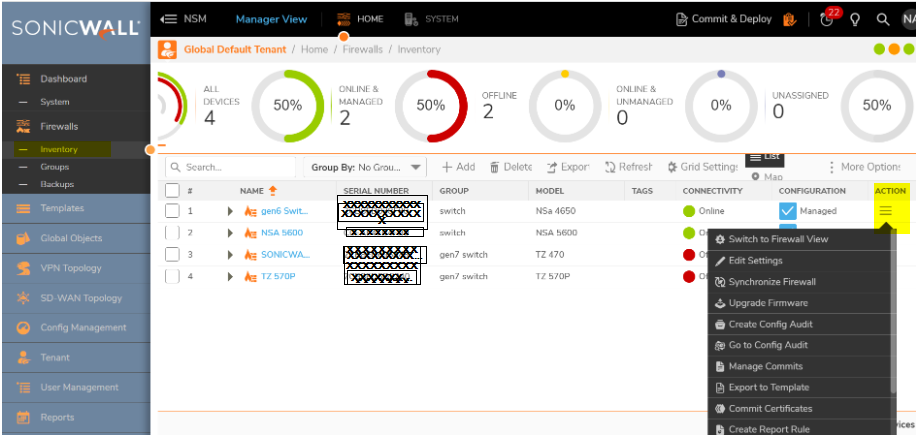
- Under Reporting and Analytics, enable the Integrate External Analytics Agent for this device button.
- Select the added analytics agent from the dropdown of Analytics Agent field.
- Click Save.
Step4: Accessing the Analytics data:
To access analytics data in NSM:
- Under Home, navigate to Firewalls| Inventory.
- Click on the firewall which you have integrated with either IPFIX or Syslog to view that particular Firewall View.
- Navigate to the Monitor View to see the various analytics data as per the tabs on the left of the page
IPFIX: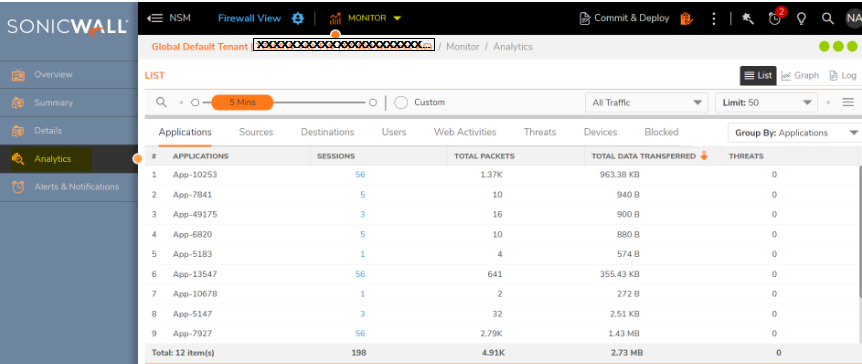
Syslog: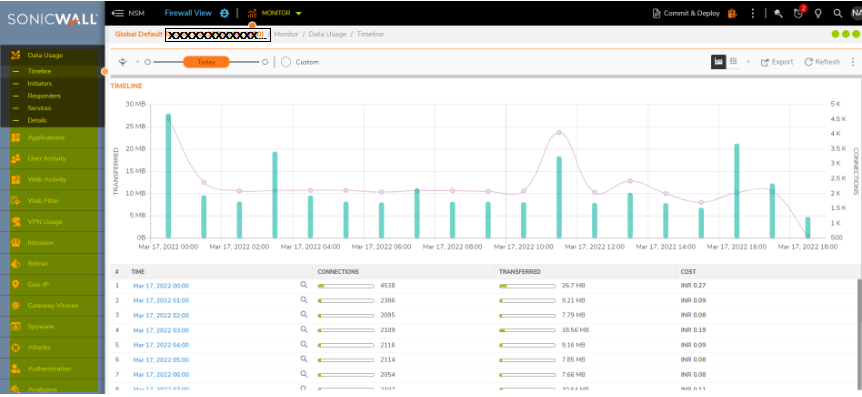
Related Articles
- Creating a license subscription report in GMS 9.3
- How to create SSLVPN login reports with Syslog GMS/Analytics
- Can I review, accept and deny the GMS changes before pushing to firewalls with workflow license?
 YES
YES NO
NO