-
Products
-
SonicPlatform
SonicPlatform is the cybersecurity platform purpose-built for MSPs, making managing complex security environments among multiple tenants easy and streamlined.
Discover More
-
-
Solutions
-
Federal
Protect Federal Agencies and Networks with scalable, purpose-built cybersecurity solutions
Learn MoreFederalProtect Federal Agencies and Networks with scalable, purpose-built cybersecurity solutions
Learn More - Industries
- Use Cases
-
-
Partners
-
Partner Portal
Access to deal registration, MDF, sales and marketing tools, training and more
Learn MorePartner PortalAccess to deal registration, MDF, sales and marketing tools, training and more
Learn More - SonicWall Partners
- Partner Resources
-
-
Support
-
Support Portal
Find answers to your questions by searching across our knowledge base, community, technical documentation and video tutorials
Learn MoreSupport PortalFind answers to your questions by searching across our knowledge base, community, technical documentation and video tutorials
Learn More - Support
- Resources
- Capture Labs
-
- Company
- Contact Us
Diagnose your network topology with SonicWall built-in Packet Monitor (layer 2 loops)


Description
Diagnose your network topology with SonicWall built-in Packet Monitor (layer 2 loops)
Resolution
Having the same subnets connected to two physical interfaces is not supported, unless the following Mode / IP assigment options are used on the interface:
- Transparent IP Mode
- Layer 2 Bridged Mode
- Wire Mode
The following problems may show up with layer 2 loops:
- Unit becomes unstable due to high CPU usage:
- tWebMain
- tWebListen
- tDataPlaneTask
- dpCore(X)
- Unit becomes unreachable due to missing ARP entry
- Unit crashes randomly
- Unit has a suspicious number of active connections
- IP spoof messages are reported by the Intrusion Prevention module
- Some devices connected to the SonicWall become unreachable randomly
Please note that ARP timeout is 10 minutes (by default).
Procedure for checking your network:
Step 1: Set up a packet capture: System | Packet Monitor | Configure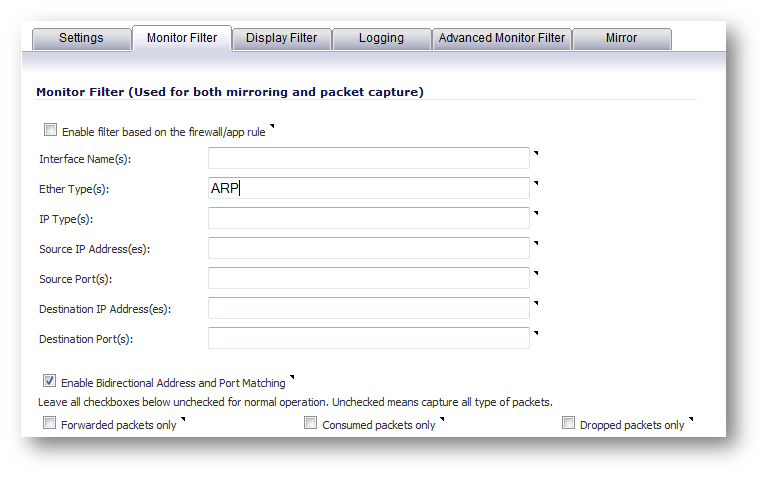
Under Monitor Filter:
Clear all the fields, set 'Ether Type' to 'ARP', Enable Bidirectional Address and Port Matching.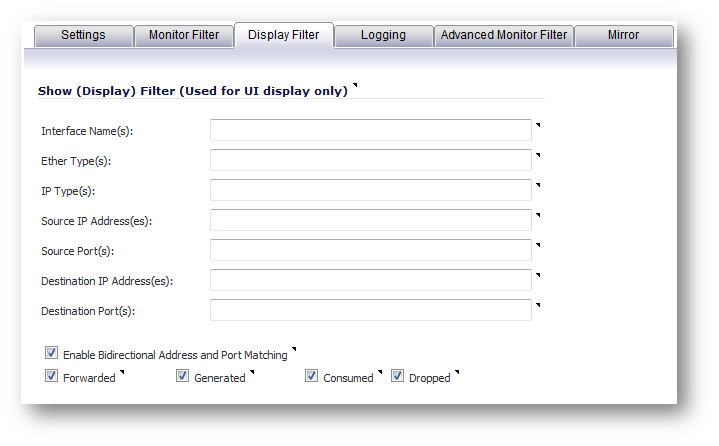
Under Display filter:
Clear all the fields, Enable Bidirectional Address and Port Matching, Enable 'Forwarded', 'Generated', 'Consumed' and 'Dropped''.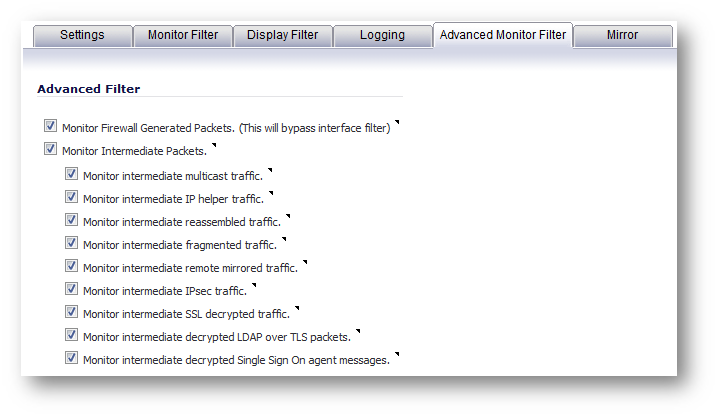
Under Advanced Monitor filter:
Enable all options.
Accept your Packet Capture settings.
Step 2: Start the packet capture using the 'Start Capture' option and wait for it to get some data.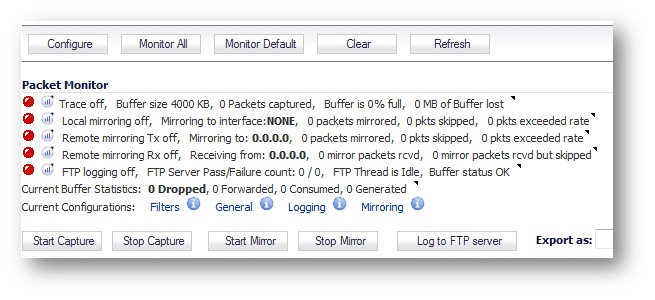
Depending on the size of your network, it may take more than 20 minutes to get a full picture of what is going on. Usually it should be much faster.
(If you are a experienced SonicWall user, you may use the 'Send Gratitious ARP' diagnostic option to generate some ARP traffic on demand)
Stop the packet capture using the 'Stop Capture' option and hit the 'Refresh' button.
Step 3: At this point you should be able to see the ARP traffic captured, similiarly to: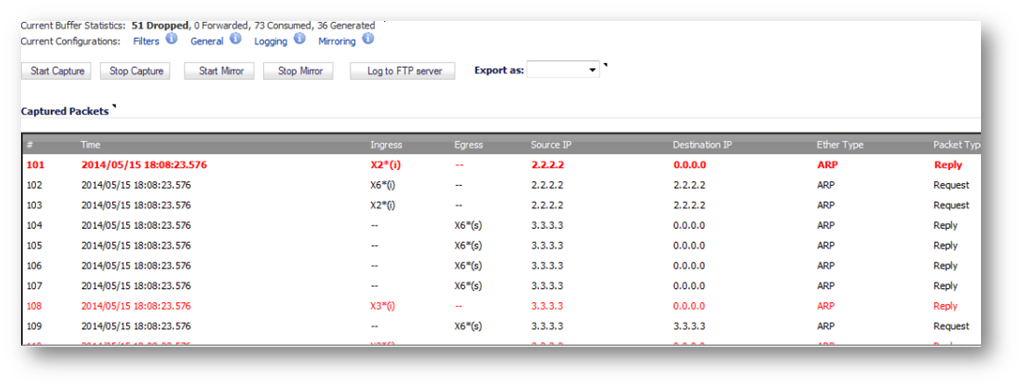
In general (to verify if a loop is present) we will be looking for:
- Packets with the 'Source IP' from a subnet different than the subnet configured on the 'Ingress' interface.
- Identical packets arriving on two different 'Ingress' interfaces at the same time.
Additionally, you may be able to see:
- Packets with the 'Source IP' 169.254.1.0 to 169.254.254.255 (inclusive). These are hosts not able to reach a DHCP server - trying auto configuration.
- Packets with the 'Source IP' 0.0.0.0 (ARP generated by some network stacks).
Step 4: In order to get a clear view, use Configure | Display Filter to show dropped packets only: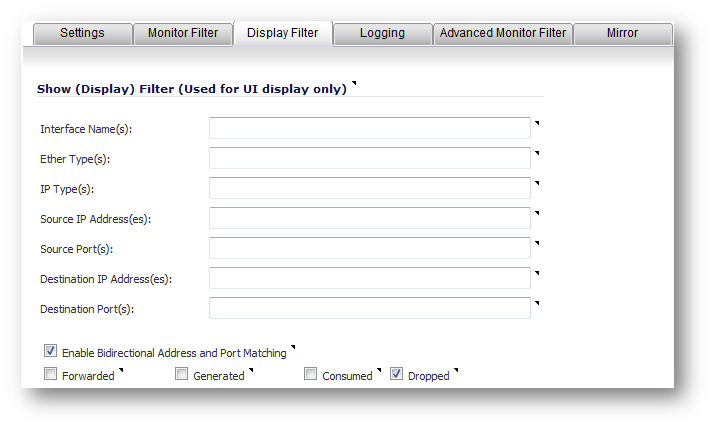
Filtered the packet capture:
Step 5: Compare captured traffic with your network settings (Network | Interfaces):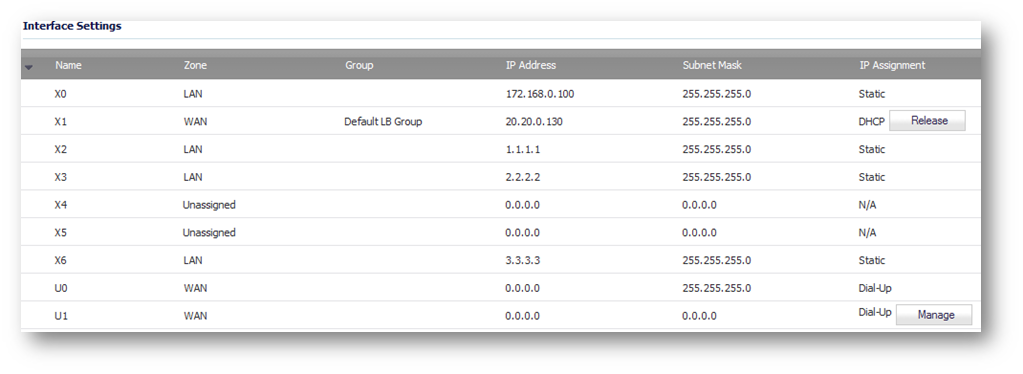
As per example, we may see the following networks:
1.1.1.0 connected to X2
2.2.2.0 connected to X3
3.3.3.0 connected to X6
Filtered packet capture (Step 4) shows:
1.1.1.1 (X2 subnet) arriving on X3 (#89) and X6 (#90)
2.2.2.2 (X3 subnet) arriving on X2 (#96) and X6 (#98)
3.3.3.3 (X6 subnet) arriving on X1 (#108) and X2 (#110)
which indicates that X2, X3 and X6 are bridged.
Please note, that packets from a VLAN tagged interfaces should also be limited to their VLAN interfaces.
F.i.: 11.11.11.15 host on X2:V11 should not be visible on X2:V16.
Vlan tagged packets should not show up on non-vlan interfaces.
Resolution steps are listed below:
- Check if your switches are connected properly.
- Check if VLAN tagging is set up properly in your network.
- Check NAT policies on the SonicWall, specify inbound and outbound interfaces for each policy, if possible.
- Check if servers connected to multiple subnets are not bridging ARP traffic.
- Check if PCs/laptops connected to multiples subnets are not bridging ARP traffic (especially users connected simultaneously via WiFi and Cable).
- Check if there is any source of multicast traffic in the network.
Related Articles
- How to Block Google QUIC Protocol on SonicOSX 7.0?
- How to block certain Keywords on SonicOSX 7.0?
- How internal Interfaces can obtain Global IPv6 Addresses using DHCPv6 Prefix Delegation
Categories
- Firewalls > TZ Series
- Firewalls > SonicWall SuperMassive E10000 Series
- Firewalls > SonicWall SuperMassive 9000 Series
- Firewalls > SonicWall NSA Series


 YES
YES NO
NO